About Me
Hi! I'm Osthailyd, and I'm a Data Scientist | AI Engineer | BI Expert 🚀
Passionate about transforming data into strategic insights! 📊✨ With a strong background in Data Science, AI, and Business Intelligence, I specialize in Big Data processing, predictive modeling, and dashboard creation to drive business impact.🔹 Tech Stack: Python 🐍 (Pandas, NumPy, Scikit-Learn, TensorFlow, PyTorch), SQL & PL/SQL, Apache Spark ⚡ (PySpark), Databricks, Power BI 📊, Tableau, Microsoft Fabric, Azure & AWS ☁️
🔹 Skills: Data Engineering, Machine Learning, NLP, ETL Pipelines, AI Optimization, BI Development
🔹 Projects: Customer segmentation, AI-powered forecasting, recommender systems, and real-time analytics.🎯 I love building data-driven solutions that optimize decision-making, enhance efficiency, and unlock new opportunities. Ready to make an impact with cutting-edge AI & BI solutions!
Skills

Excel | Power BI | SQL | Python | Power Automate | Power Apps | Microsoft Fabric | PySpark | PL/SQL| Machine Learning | Deep Learning
Featured Projects
SQL | POWER BI
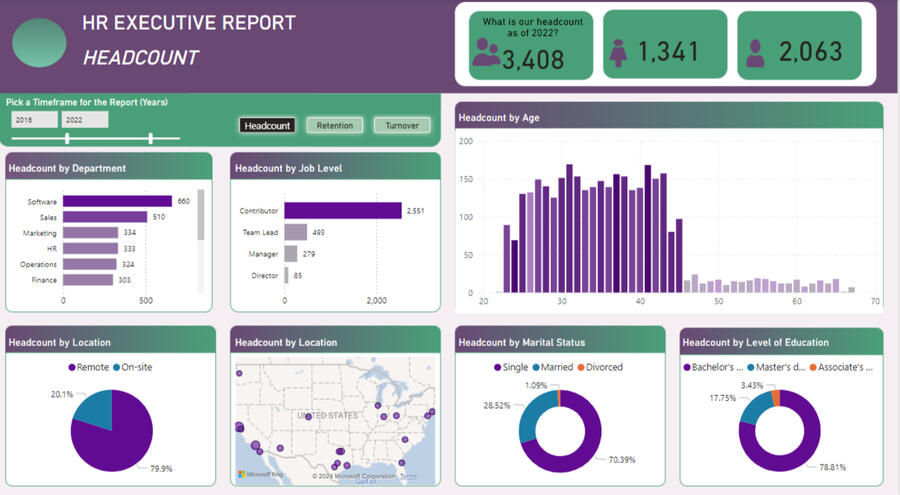
HR EXECUTIVE REPORT
Replace a manual process by creating a SQL script and Power BI Report to pull and visualize HR metrics
SQL | POWER BI
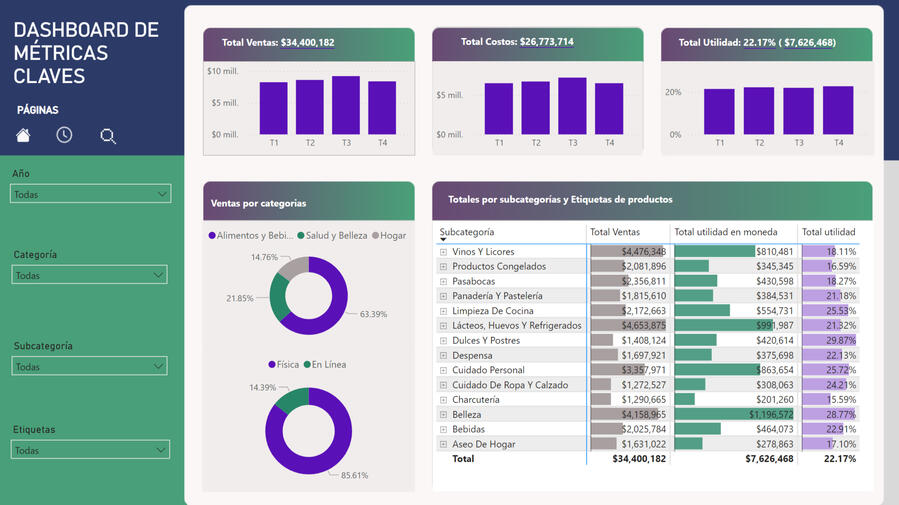
STORE SALES METRICS REPORT
The Store Sales Metrics Report provides a comprehensive overview of the key performance indicators (KPIs) essential for monitoring the success of the food retail business
EXCEL
INCOME AND EXPENSES ANALYSIS DASHBOARD
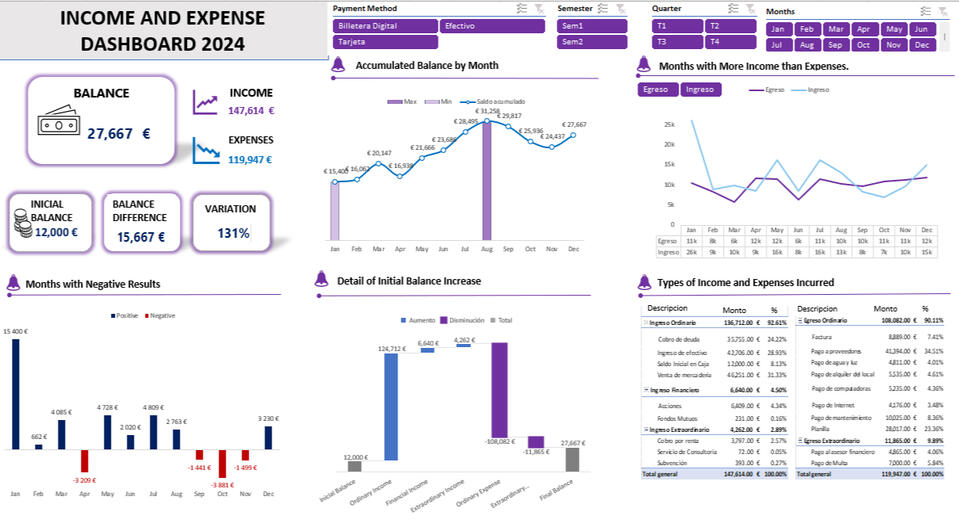
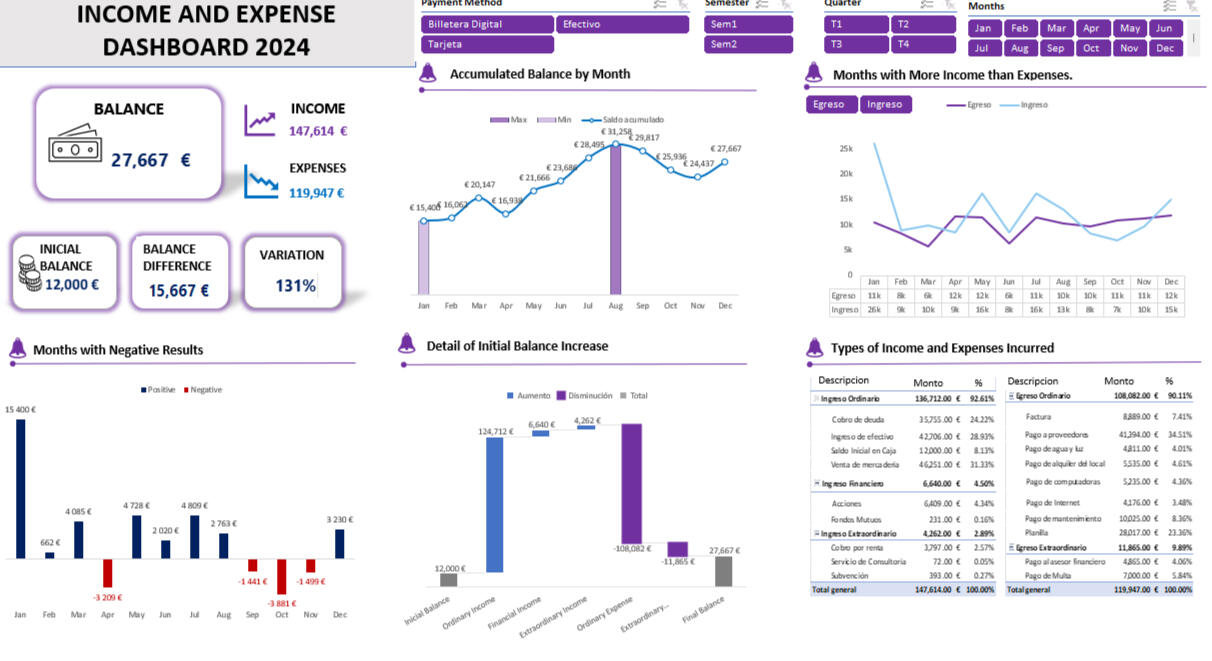
This dashboard provides a clear view of company income and expenses by type, payment method, and quarterly and semiannual periods. Created using Excel, it enables stakeholders to quickly identify cash flow patterns and financial trends, facilitating better decision-making.
Python, pysparkPersonalized Product Recommendation Engine with PySpark for Massive Data Environments
Imagine a recommendation engine that adapts in real time to millions of user interactions, offering a tailored experience on a massive scale. This project involved the design and deployment of a sophisticated recommendation system, leveraging PySpark's robust capabilities in big data processing.


Python, MACHINE LEARNING, SK-MEANSCustomer Segmentation for the Implementation of New Marketing Campaigns
This project clusters customers using income and spending data, identifying key segments to tailor marketing strategies and improve campaign effectiveness based on financial behavior insights

PYTHON, MACHINE LEARNING, AND STREAMLITPredictor of employee elegible to promotion and Web Application
HR analytics is transforming human resources by boosting efficiency and results. While HR has long used analytics, manual data handling has limited its potential. Adopting machine learning now allows HR to leverage predictive analytics, such as identifying employees likely to be promoted using an app with relevant data.
POWER BI | POWER APPS | POWER AUTOMATE | DATAVERSESALES LEADERSHIP RANKING APPLICATION AND DASHBOARD CONNECTED
This project demonstrates expertise in Power BI, Power Apps, Dataverse, and Power Automate, with a focus on real-time data integration and automation to enhance business intelligence solutions.
Education

Specialization Course in Big Data and IA.Spain 2025

Executive Master in Data Science.Spain, 2022

Bachelor's Degree Engineer Civil. Colombia,2016
Professional Certifications
My growing list of propietary, exam-based certifications.

Power BI Data Analyst Associate. Issue 2024

Microsoft Azure Fundamentals. Issue 2024

Scrum Manager. Issue 2023
SQL | POWER BI
HR EXECUTIVE REPORT
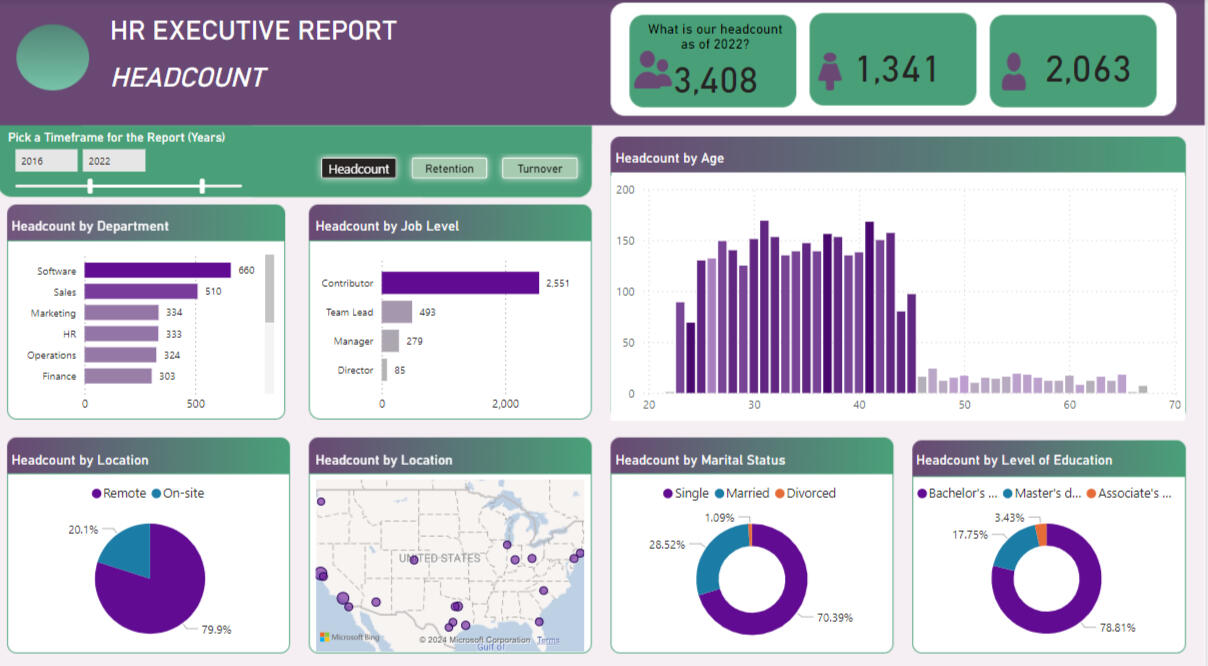
📉 From Data to Insights: Building a Dynamic HR Execute Report 🚀📌 Impact of the Report for the HR Department:🔥This report provides HR with real-time, data-driven insights that empower better decision-making. It enables the team to track key metrics like employee retention, turnover, and headcount trends, helping them identify areas for improvement ☝ .With interactive features, HR can easily analyze data by department or location, uncovering patterns and trends that drive more strategic workforce planning. The report not only improves operational efficiency but also enhances HR’s ability to support business goals with clear, actionable data 📊 .This is a HR Executive report from start to finish, including:⭐ Modeling the data into a star schema using the Power Query Editor

⚒ Building out DAX measures for headcount and employee retention & turnover

💥 Designing a custom layout using Figma, integrating interactive features like a slicer panel, and a really cool cover page! 🖌

The following questions are proposed for consideration in the report, along with the corresponding insightsHow many employees does the company have, and how are they distributed across various parameters such as department, job level, and location, among others?As of 2023, the company employs a total of 3,408 individuals, with a gender distribution of 1,341 men and 2,063 women. This indicates that 60% of the workforce is female. While there is a slight majority of female employees, the workforce is considered well-balanced overall, without any indication of significant gender polarization.Regarding work arrangements, 80% of employees operate remotely, with the remaining 20% working on-site. The age distribution of the workforce ranges from 23 to 45 years, with a fairly even spread across this range. Beyond the age of 45, only 15% of the workforce is represented.A significant portion of the workforce is single, and 90% of employees hold a bachelor’s degree as their highest level of education.What are the trends in employee retention?Employee retention has improved over the past two years, reaching 99.99% in 2022 and a full 100% so far in 2023. The overall trend shows a steady increase, with the exception of 2021, where there was a significant drop in retention due to the global pandemic.The R&D and Finance departments have experienced the lowest retention rates, whereas the Software and Legal departments have achieved the highest retention percentages.Are the employee retention strategies implemented by the Human Resources department proving to be effective?The impact of the employee retention strategies has undoubtedly been positive, showing improvement compared to the previous year.What are the primary causes of employee turnover within the company? Employee turnover is classified into two main categories: voluntary and involuntary departures, accounting for 45% and 55%, respectively. Among voluntary departures, the pursuit of better salary opportunities and career changes are the leading reasons.It is recommended to review the company's salary structure and conduct market salary range assessments, as well as to adopt non-monetary incentive systems.
POWER BI | POWER APPS | POWER AUTOMATE | DATAVERSE
SALES LEADERSHIP RANKING APPLICATION AND DASHBOARD CONNECTED
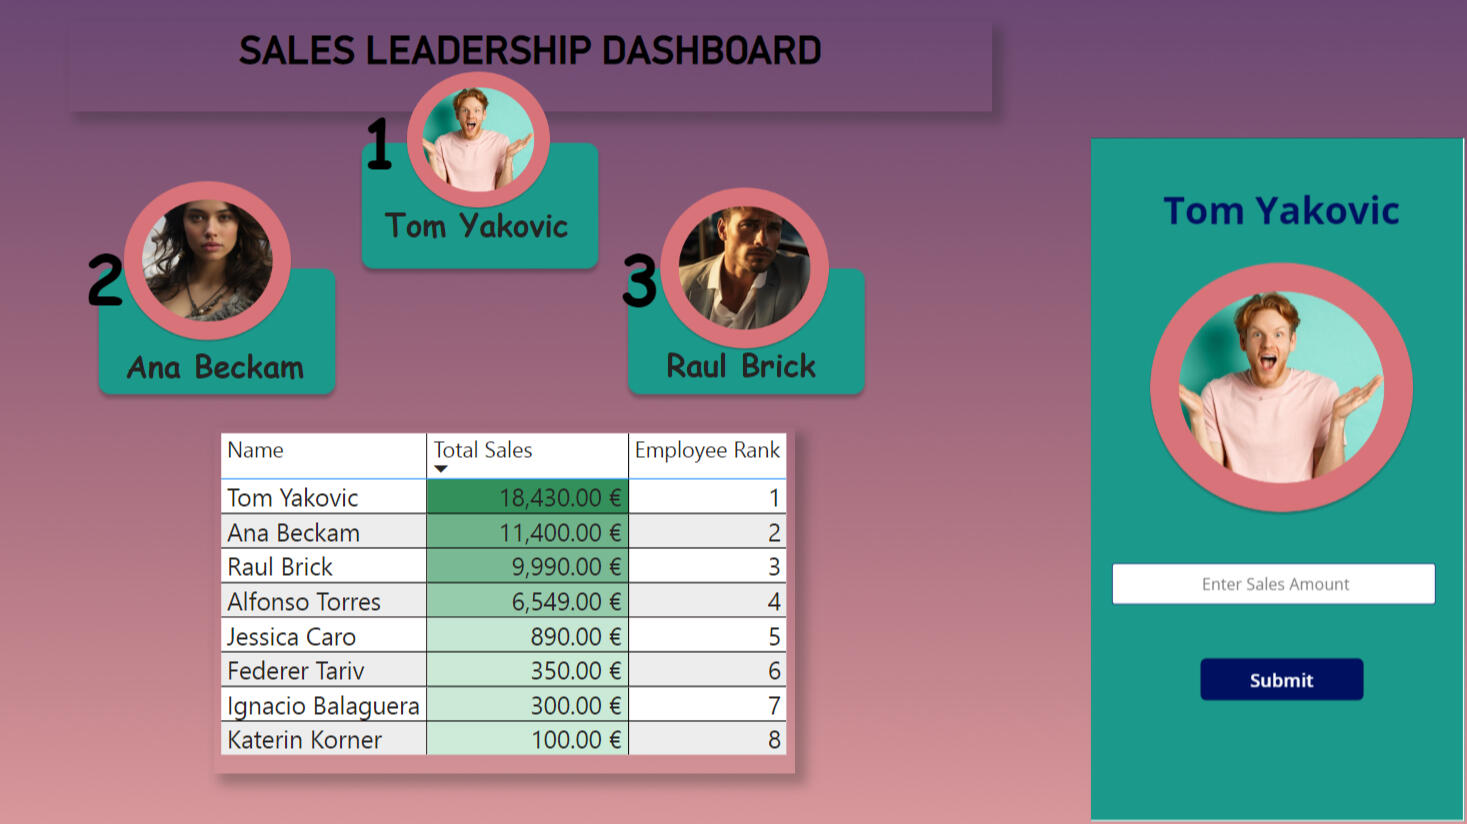
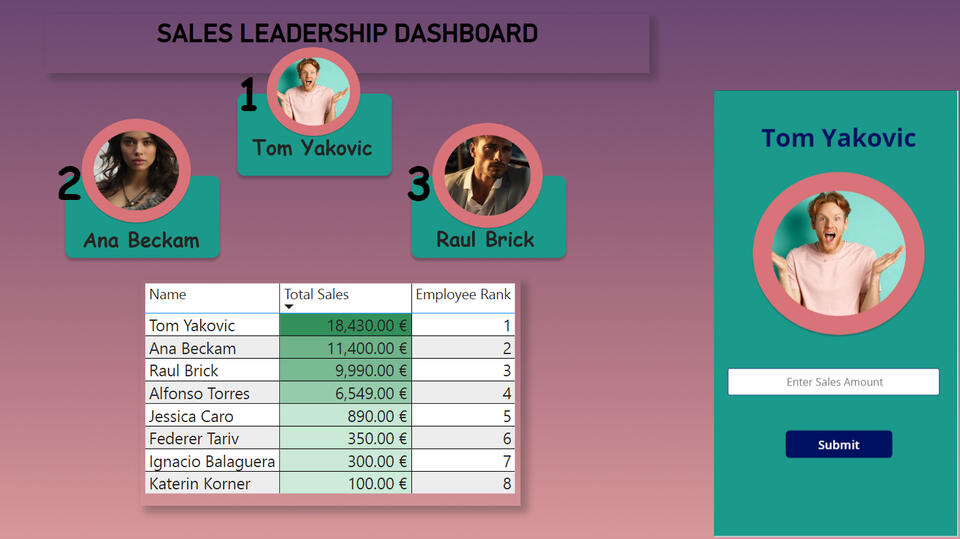
The Sales Leadership Dashboard is an interactive Power BI dashboard designed to monitor and compare sales performance across employees in real time. Integrated with Power Apps, the dashboard allows employees to input their sales directly into the app and immediately see how they rank against their peers. Data is stored in Dataverse, ensuring a smooth flow between Power BI, Power Apps, and Dataverse. Additionally, Power Automate is incorporated to send automatic email notifications each time a new sale is registered. This project showcases the power of integrated Microsoft tools for real-time sales tracking and performance analysis.Business Problem Solved:
This solution addresses the challenge of fragmented and delayed sales performance tracking within organizations. Traditional methods of manually collecting, analyzing, and reporting sales data often lead to delays and inaccuracies. By automating and centralizing the sales process, the dashboard ensures accurate, up-to-date insights.Business Improvement:
The Sales Leadership Dashboard streamlines sales tracking by providing real-time visibility into employee performance. It enhances decision-making for managers, fosters healthy competition among sales staff, and reduces administrative overhead. The automation of email notifications ensures that stakeholders are promptly informed of key sales activities, improving overall sales management efficiency.Project Objectives (Step-by-Step):1. Data Storage in Dataverse
Sales data, including employee details and sales performance, is securely stored and managed within Dataverse.2. Data Integration with Power BI
The Sales Leadership Dashboard in Power BI is connected to Dataverse, dynamically pulling data to visualize sales performance and rank employees based on their achievements.3. Power Apps Integration
A Power Apps application is embedded within the dashboard. Employees use this app to enter their sales data, which is immediately reflected in the Power BI dashboard for real-time comparisons.4. Automated Notifications via Power Automate
Power Automate is integrated to automatically send email notifications whenever a new sale is made, ensuring managers are kept up to date on sales activities.5. Real-Time Sales Performance Tracking
Employees can track their sales in real time and see how their performance stacks up against their colleagues, fostering a competitive and motivating environment.This project demonstrates expertise in Power BI, Power Apps, Dataverse, and Power Automate, with a focus on real-time data integration and automation to enhance business intelligence solutions.
Sales Input Application in Power Apps- Streamling Employee Sales Data Entry

The Submit button allows employees to submit their sales data, which is directly connected to the Sales Leadership Dashboard. Once the sales are added, the data source in Dataverse is updated in real-time, and the dashboard automatically refreshes to display the new sales figures and employee rankings.

And with the following DAX formula to calculate the employee rank 1 and others in Power BI Desktop

The Power Automate Flow- Automating Emails Notifications for New Sales Entries

Here the Sales Leadership Dashboard in Power BI- Real -Time Sales Performance and Insights
EXCEL
INCOME AND EXPENSES ANALYSIS DASHBOARD
I have designed an interactive dashboard titled "Income and Expenses 2024" for a company, which not only provides a clear view of the organization's financial health but also empowers decision-makers with critical real-time information
Project Description:
In a business environment where every decision counts, this dashboard becomes an indispensable tool. Utilizing a robust dataset, I have created a detailed analysis of the financial transactions for the year 2024, categorized into income and expenses. Through key KPIs such as balance, income, expenses, initial balance, balance difference, and variation, users can quickly gain a deep understanding of their financial situation.Problem Solved:
Before implementing this dashboard, the organization faced challenges in effectively tracking its cash flows, which resulted in suboptimal financial decisions and a lack of visibility into economic health. Thanks to this project, it has been possible to:Quickly identify critical months with negative results, allowing managers to make informed decisions about budget adjustments.
Visualize variations in the initial balance and how these affect overall performance, facilitating long-term financial planning.
Impactful Visualizations:

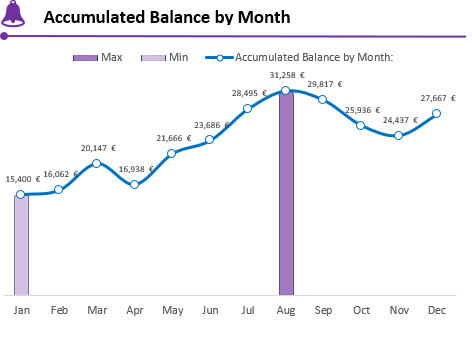
Months with Negative and Positive Results: A column chart that allows for immediate identification of financial performance periods, helping prioritize corrective actions.Detail of Initial Balance Increase: A waterfall chart that illustrates how the balance has increased, providing a visual narrative of financial decisions.Accumulated Balance by Month: A line chart that reveals the evolution of the total balance, facilitating the identification of trends and patterns over time.Months with More Income than Expenses: This visualization highlights the most prosperous periods, guiding growth strategies.Types of Income and Expenses: A detailed table that provides a comprehensive breakdown of transactions, allowing users to delve into the context of their finances.
Dynamic Filters:

TextPayment Methods: Allows filtering by payment method, such as cash or card, for more specific analysis.
Semester and Quarter:Improves the temporal contextualization of the information.
Months: Breaks down the data for a granular view, ideal for tracking financial trends.
Impact and Added Value:
This dashboard not only optimizes financial management but also transforms the way organizations interact with their data. By increasing transparency and facilitating informed decision-making, this project highlights my ability to generate value through data analysis.
Python, pyspark
Personalized Product Recommendation Engine with PySpark for Massive Data Environments

Overview
I developed a highly scalable product recommendation system using the Retailrocket dataset, applied in a big data environment with PySpark. This project demonstrates the ability to personalize the user experience on an e-commerce platform through advanced machine learning algorithms and predictive modeling techniques.Objective
The objective was to build a system that not only suggests relevant products but is also efficient at processing large volumes of data. The model is designed to capture behavior patterns across multiple interaction types, optimizing recommendation accuracy and enhancing user experience.Dataset and Modeling Approach
-Dataset: Retailrocket Recommender System Dataset (millions of user-product interactions).
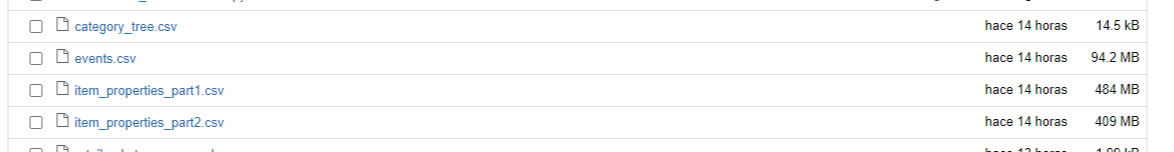
Dataset and Modeling Approach
Dataset: Retailrocket Recommender System Dataset (millions of user-product interactions).
Key Variables:
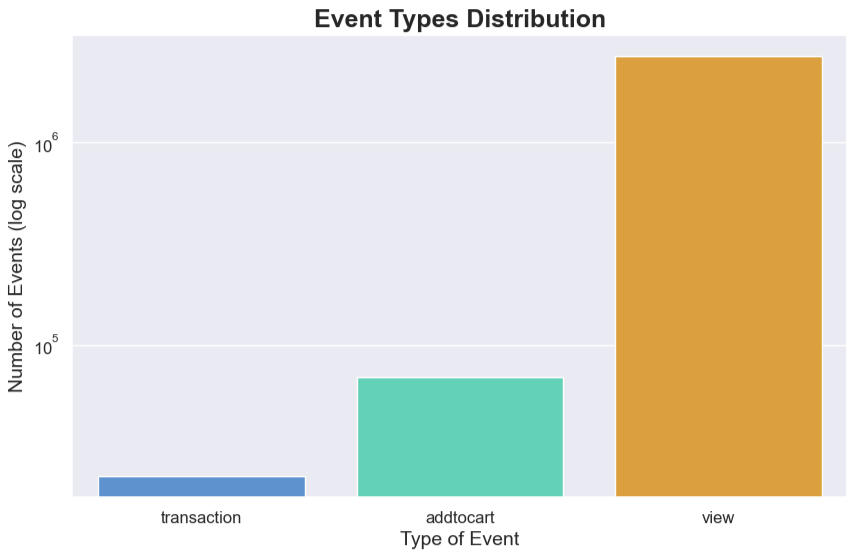
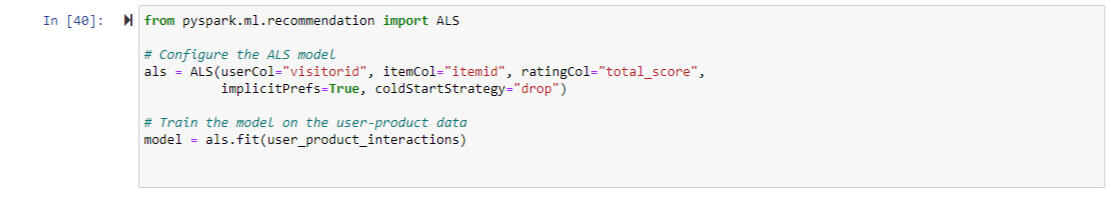
-event: Defines the nature of interaction (view, addtocart, transaction), enabling us to interpret user interest.-itemid and visitorid: Unique identifiers for products and users, respectively, handled as keys in the model.-Technique: Recommendation model based on implicit interactions using ALS (Alternating Least Squares) from PySpark, ideal for handling massive data in distributed systems.
Development ProcessData Exploration
1.Data Preparation and Initial Exploration:Conducted a thorough data analysis to understand user behavior and interaction trends.
Interaction Weighting:
Assigned a weight to each interaction type to prioritize those that reflect a higher level of interest. This “interaction score” approach enables the model to distinguish between mere views and actual transactions.

Exploratory Data Analysis
Event Types Distribution:
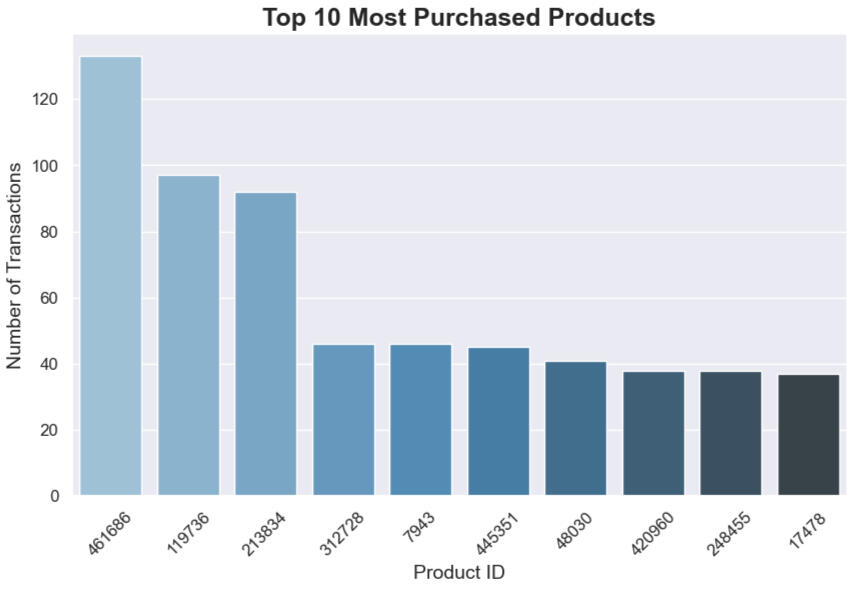
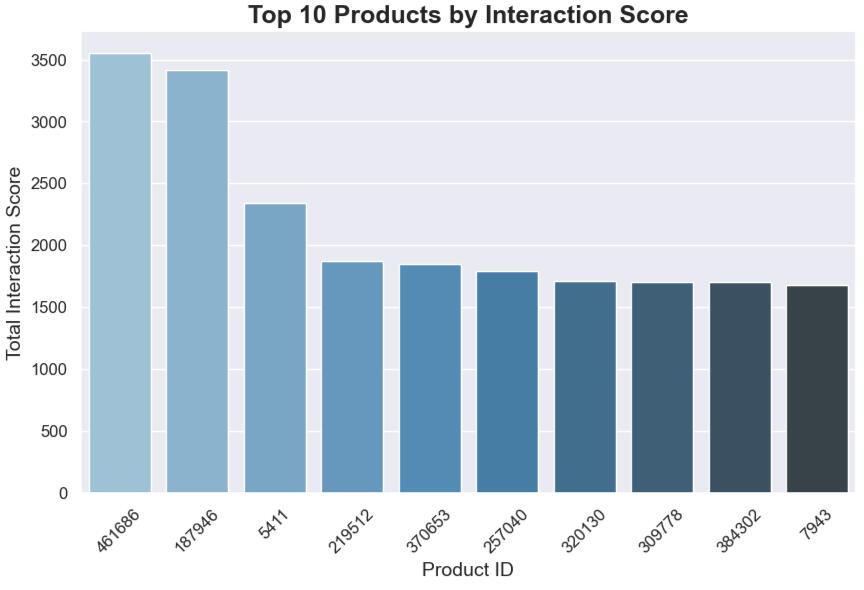
Most Popular Products:
User Interactions:
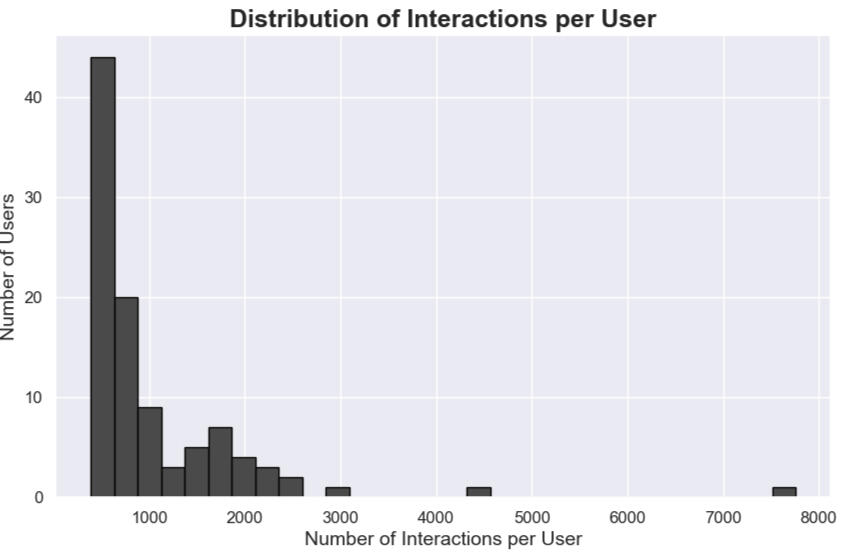
Key Insights:
2.Visualization and Exhaustive Analysis
3.Predictive Modeling with ALS
Algorithm Selection: ALS was selected for its efficiency in handling implicit feedback—essential in recommendation systems where ratings aren’t explicit.
Optimization and Tuning:Extensive tuning of regularization and latent factor parameters to achieve an optimal balance between performance and accuracy, achieving significant gains in RMSE.
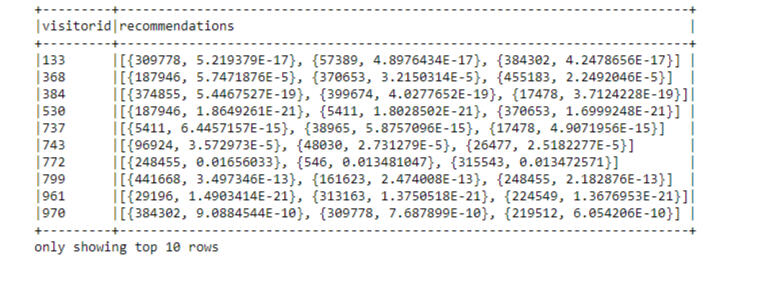
4.Tailored Recommendations
The model predicts the top 3 most relevant products for each user based on their interaction history, creating a highly personalized experience.
This method provides insights into trending products and supports adaptive inventory decisions, enhancing both user satisfaction and business responsiveness.
Python, MACHINE LEARNING, SK-MEANS
Customer Segmentation for the Implementation of New Marketing Campaigns
GOAL
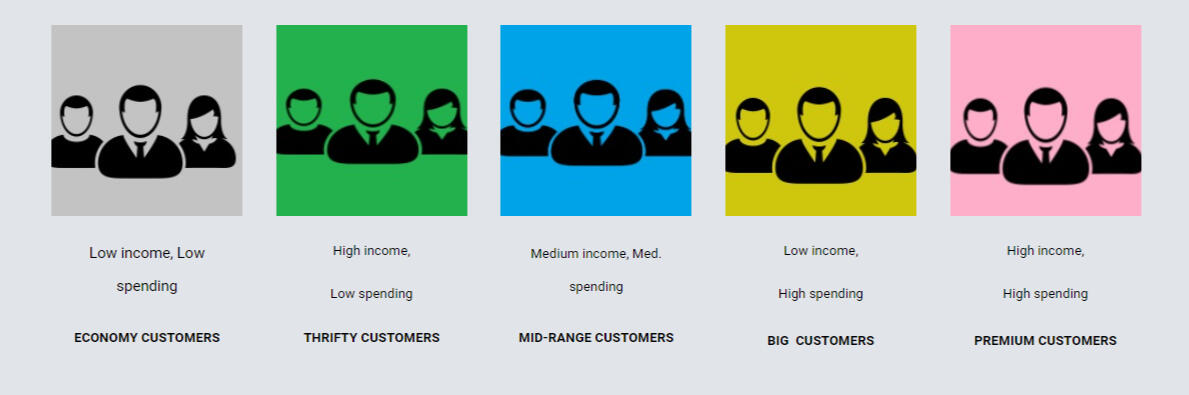
Customer segmentation is crucial for various marketing strategies, as it allows for targeted approaches based on specific customer groups, enhancing precision and effectiveness in reaching the intended audience. In addition to simply having the data, one must also know how to extract information from it. A company provides its customers' information for segmentation to enhance the implementation of marketing strategies.PROJECT DESCRIPTION
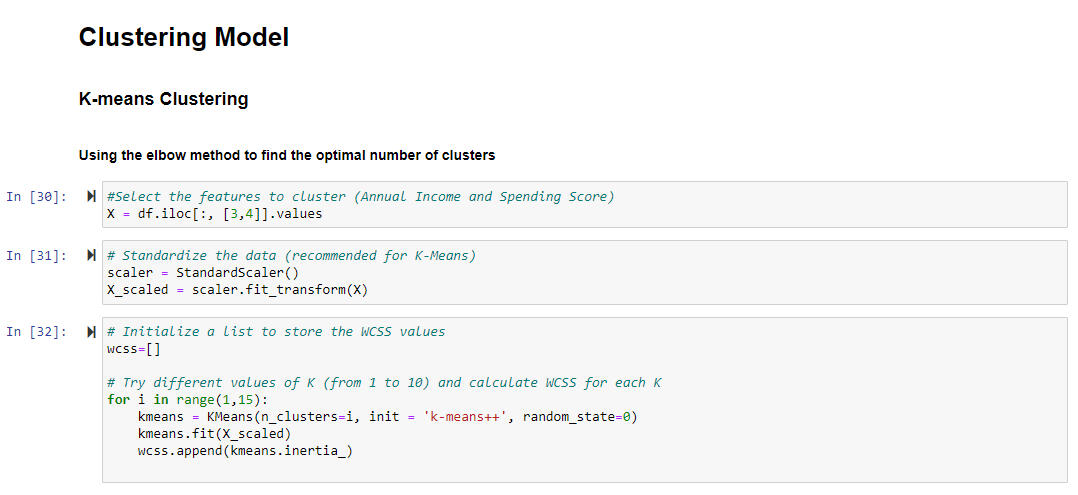
The project included exploratory data analysis (EDA), preparing the data, grouping data points, and understanding these groups. The clustering utilized the KMeans algorithm, validated through the silhouette score. Visualizing and interpreting these clusters yielded valuable insights for focused marketing efforts and product improvement. This approach is adaptable to other customer datasets, making it a flexible tool within the retail sector.
Methodology:
1.Data Preparation:
Cleaned and preprocessed the dataset, focusing on key financial metrics (annual income, spending score) to ensure quality insights.

2.Exploratory Data Analysis EDA
An integral exploration of the initial data is vital for comprehending the dataset's arrangement, attributes, and possible anomalies prior to advancing into subsequent analysis or modeling stages.
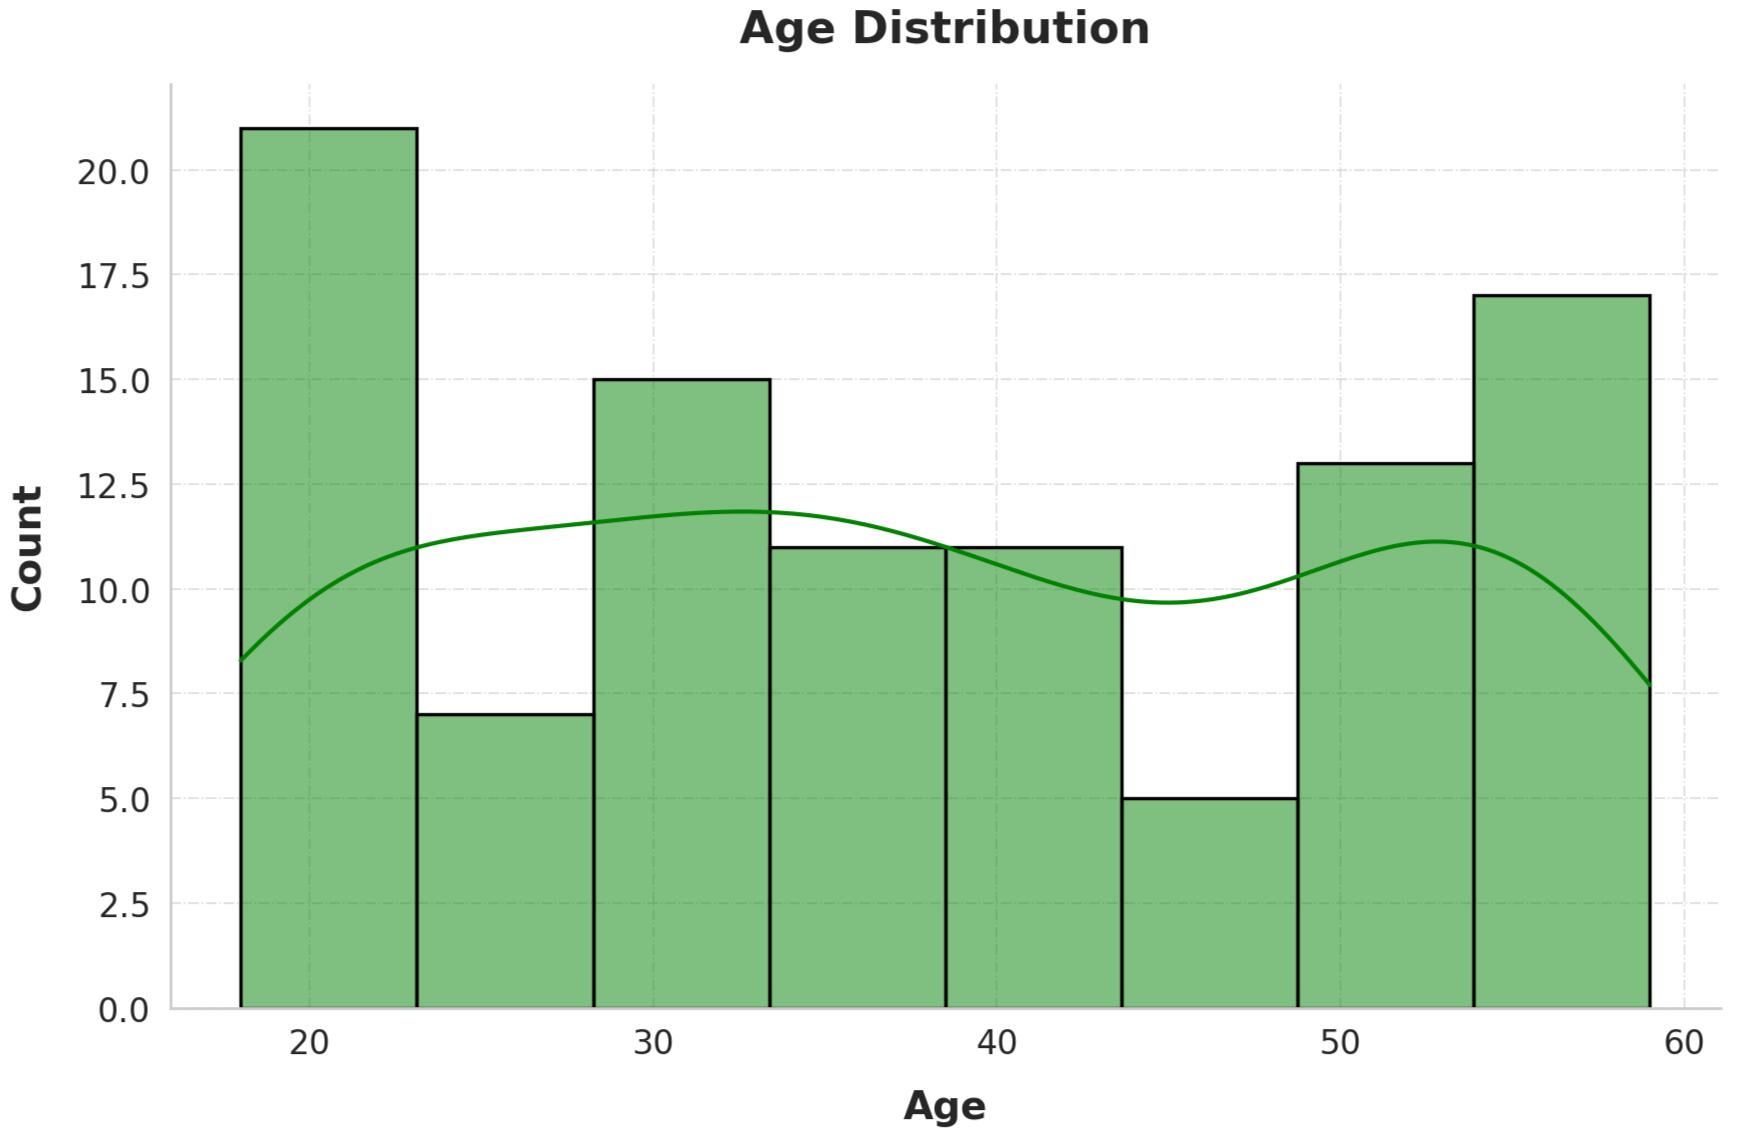
The age distribution chart reveals that most individuals fall within the 20 to 50-year range, indicating a predominantly adult demographic. The KDE curve highlights specific peaks, suggesting common age subgroups within this range. Such insights are valuable for targeted marketing strategies or demographic analysis, enabling a more focused approach on age-dominant groups.
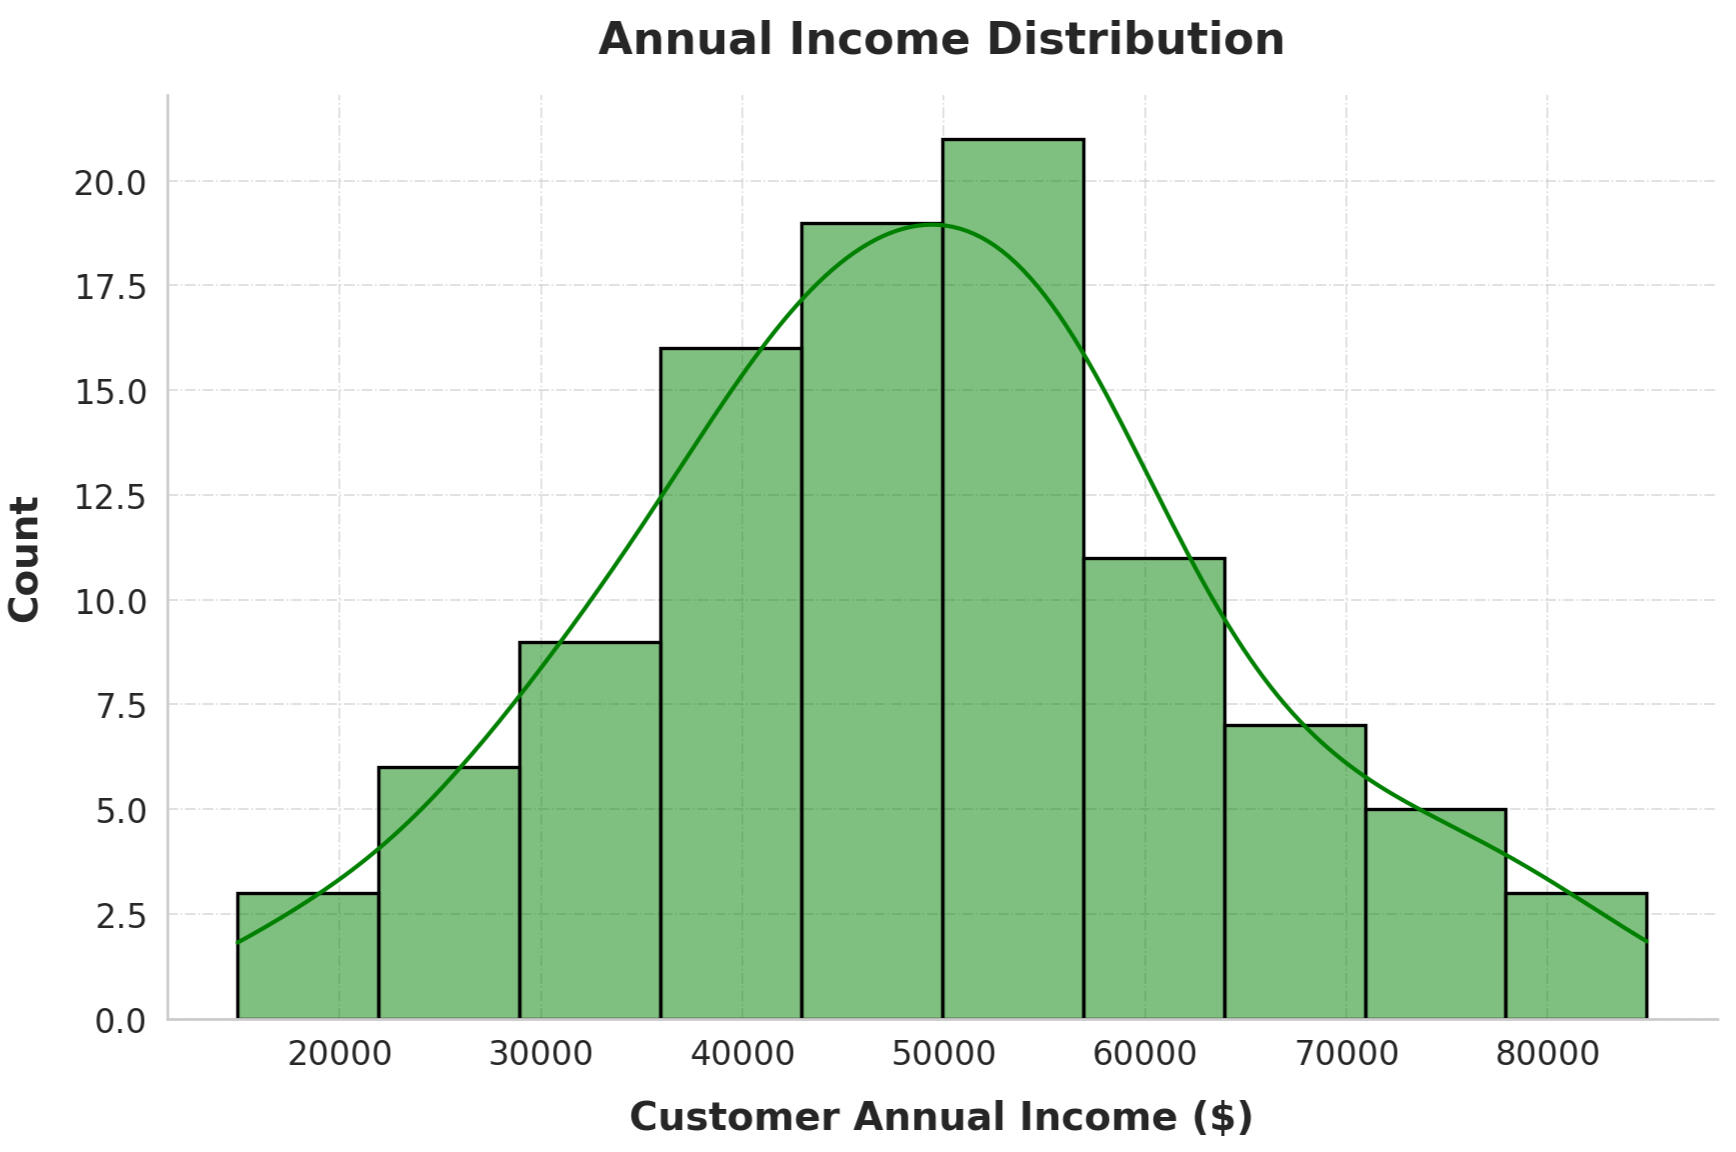
The annual income distribution chart illustrates a central concentration around typical income levels, with the KDE curve indicating peaks that suggest common income brackets among customers. This insight is essential for understanding purchasing power within customer segments, aiding in the development of targeted financial strategies or tailored marketing initiatives aimed at specific income groups.
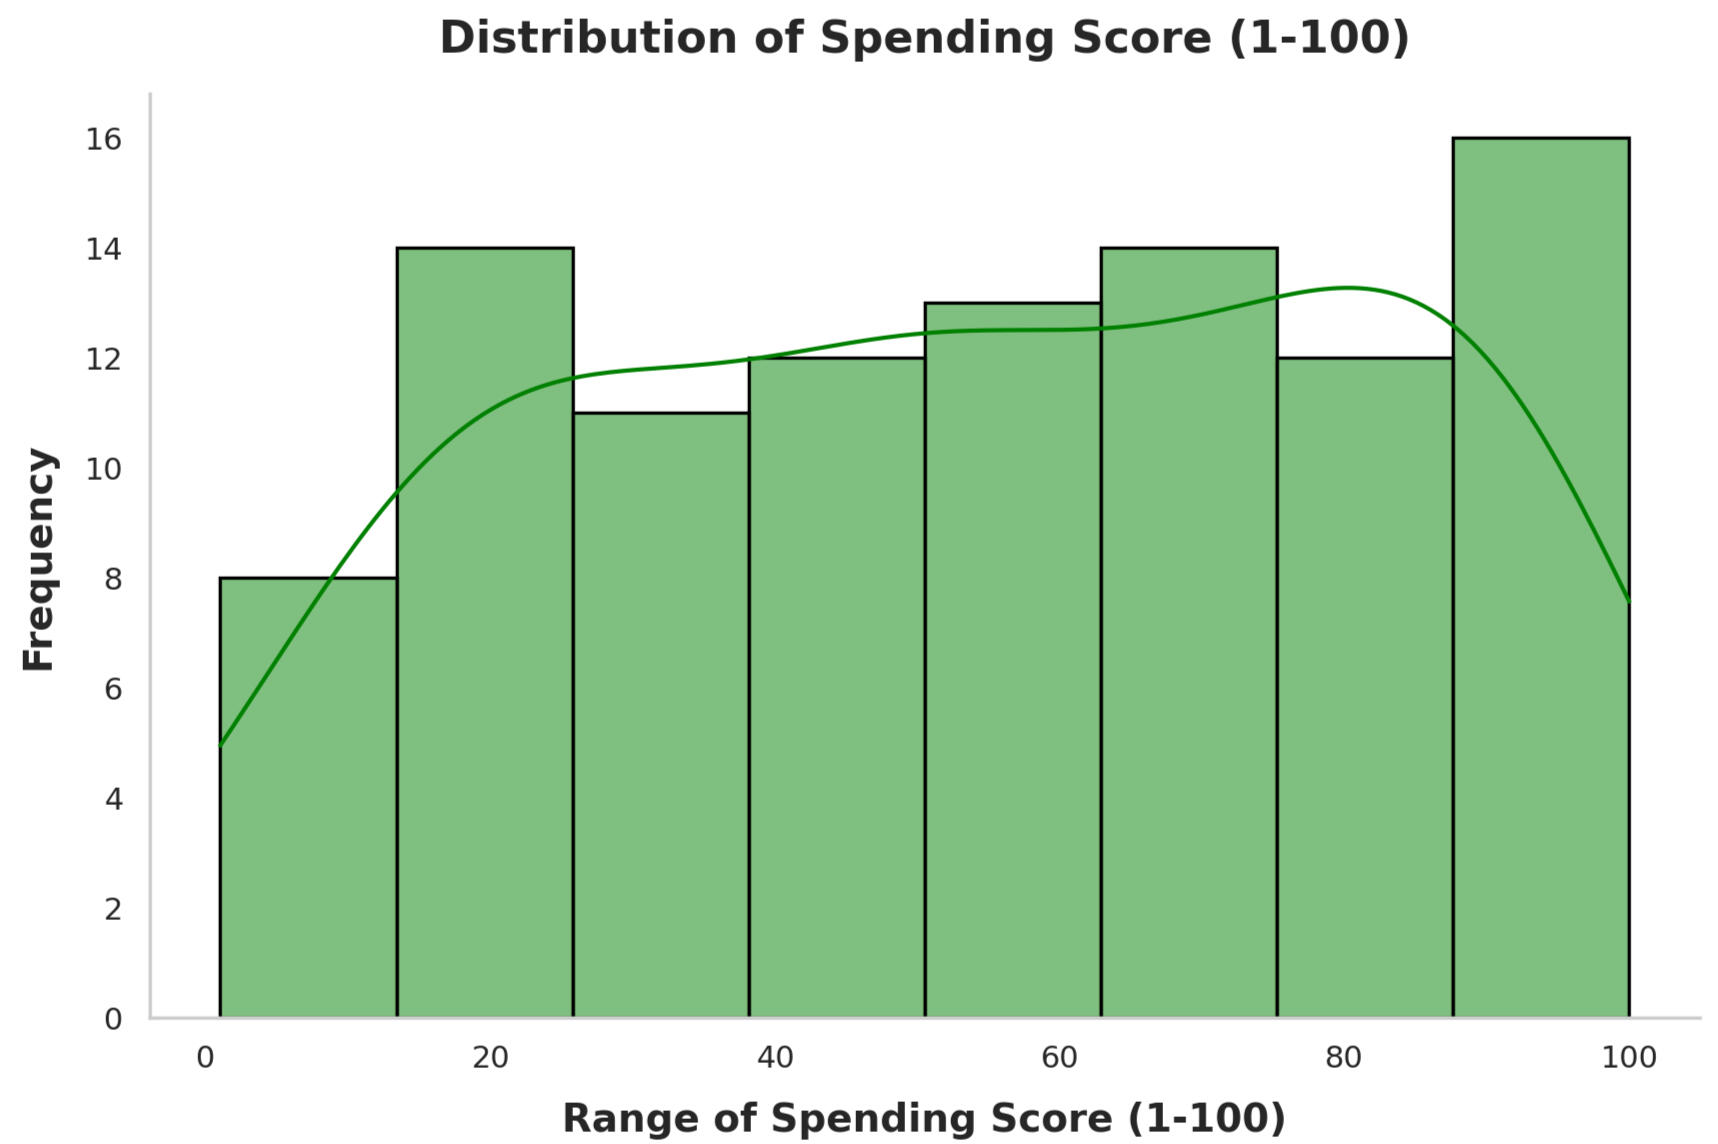
The distribution of spending scores highlights the frequency of customer expenditure levels, with notable peaks indicating common spending behaviors. This insight is valuable for segmenting customers based on their spending tendencies, supporting tailored marketing strategies and enhancing customer engagement by targeting specific spending profiles.
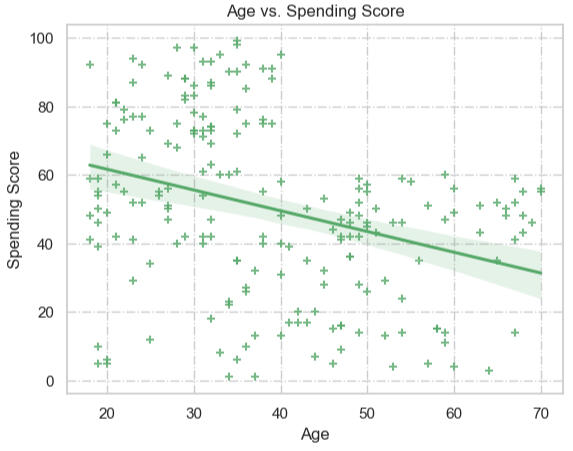
The "Age vs. Spending Score" plot reveals how spending tendencies vary across age groups, with the regression line providing insights into general spending trends by age. This analysis is crucial for identifying age segments with specific spending behaviors, supporting data-driven decisions in targeted marketing and customer relationship management.
3.Clustering Algorithm
Applied K-means clustering to segment customers into distinct clusters.
4.Cluster Profiling:
Analyzed each cluster's characteristics based on income and spending, providing insights into high-value and high-potential customer groups.
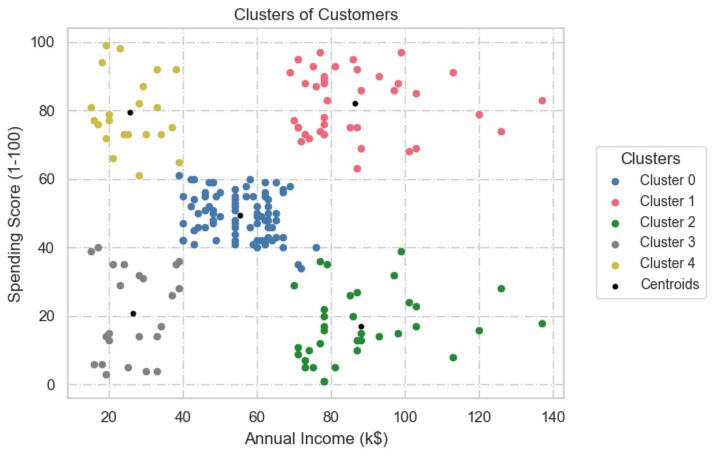
5.Visualization:
Developed insightful visualizations to effectively present cluster profiles and support strategic decision-making.